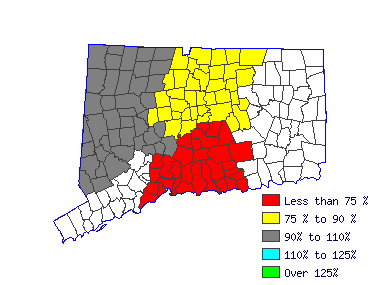
| Wind wire coils used in electrical components, such as resistors and transformers, and in electrical equipment and instruments, such as field cores, bobbins, armature cores, electrical motors, generators, and control equipment. |
 |
| Mean Wage History |
| Year | This
Occupation | Compared to
Occupational Group | Difference |
| Current | $18.67 | | $17.54 |
| $1.13 |
| 2015 | $18.08 | +3.3% | $16.98 |
+3.3% | $1.09 |
| 2014 | $17.67 | +2.3% | $16.60 |
+2.3% | $1.07 |
| 2013 | $17.33 | +1.9% | $16.29 |
+1.9% | $1.05 |
| 2012 | $17.05 | +1.7% | $16.01 |
+1.7% | $1.03 |
| 2011 | $16.77 | +1.6% | $15.76 |
+1.6% | $1.02 |
| 2010 | $16.59 | +1.1% | $15.59 |
+1.1% | $1.00 |
| 2009 | $16.30 | +1.8% | $15.32 |
+1.8% | $0.99 |
| 2008 | $15.88 | +2.7% | $14.92 |
+2.7% | $0.96 |
| 2007 | $15.51 | +2.3% | $14.57 |
+2.3% | $0.94 |
| Year | This
Occupation | Compared to
All Occupations | Difference |
| Current | $18.67 | | $19.32 |
| -$0.64 |
| 2015 | $18.08 | +3.3% | $18.78 |
+2.9% | -$0.70 |
| 2014 | $17.67 | +2.3% | $18.38 |
+2.2% | -$0.70 |
| 2013 | $17.33 | +1.9% | $18.01 |
+2.1% | -$0.67 |
| 2012 | $17.05 | +1.7% | $17.70 |
+1.7% | -$0.65 |
| 2011 | $16.77 | +1.6% | $17.42 |
+1.6% | -$0.64 |
| 2010 | $16.59 | +1.1% | $17.13 |
+1.7% | -$0.53 |
| 2009 | $16.30 | +1.8% | $16.90 |
+1.4% | -$0.59 |
| 2008 | $15.88 | +2.7% | $16.46 |
+2.6% | -$0.58 |
| 2007 | $15.51 | +2.3% | $15.94 |
+3.3% | -$0.42 |
 |
|
| Reference Date: 1st Quarter 2016 |


